 ENGLISH
  DEUTSCH
  简体中文
简体中文  ESPAñOL
  한국어
한국어 
Improving Welding Robot ROI by Fixing What Feeds It
Ask a plant manager why their welding robot isn’t hitting its business case, and the instinct is to look at the robot: the torch, the program, the weld parameters. But walk the cell for a shift and a different picture emerges. The robot is fine. The robot is waiting. It’s waiting for a tray that hasn’t been loaded, for an operator who’s clearing a jammed part, for a bin that’s “empty” while a quarter of the brackets still sit in its corners.
The biggest ROI lever on a welding robot usually isn’t the robot – it’s the feed. This article breaks down welding automation ROI into its real drivers and shows how each one traces back to the same place: the pick-to-weld pipeline.
What Actually Drives Welding-Robot ROI
Robotic welding ROI is usually modeled on four variables:
Uptime – the percentage of available time the arc is actually on or the robot is productively cycling. Every minute the cell idles, the capital sits still while depreciation runs.
Throughput – parts welded per hour. Cycle time is the visible half; the invisible half is how consistently parts arrive so cycles can start back-to-back.
Labor content – how many people the cell needs around it to keep it fed, and what those people could be doing instead.
Capital efficiency – how the investment is spread. A vision system or feeder that serves one cell pays back slowly; one that serves five pays back fast.
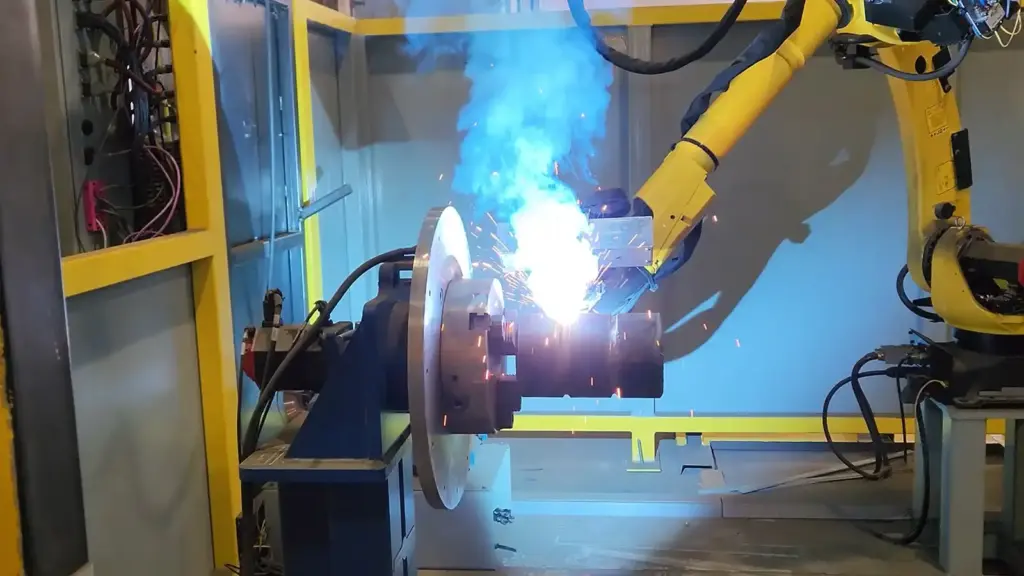
On a reliable welding robot, the weld process itself is already optimized. Shaving two seconds off a weld sequence is hard-won engineering. But if the cell loses 40 minutes a shift to feed interruptions, you’re optimizing the wrong end of the pipeline.
Let’s look at it this way: The weld is the constant; the feed is the variable.
The Hidden Cost: Line Stoppages and Operator Calls
Feed failures rarely appear in the ROI spreadsheet because they are often buried inside “miscellaneous downtime.” In many production environments, a typical scenario looks like this:
A part arrives misoriented, causing the robot to fault. An operator walks over, unlocks the cell, clears the part, resets the system, and returns to their work. Total duration: four to eight minutes. Frequency: several times per shift. Because each individual event is minor, it is rarely logged as a systemic issue.
When scaled across an operation, the impact adds up quickly. Five call-outs a shift at six minutes each translates to 30 minutes of lost welding time per cell, per shift. Across three shifts and multiple cells, a body shop can quietly lose the output equivalent of an entire cell to feed interruptions, all while every single incident remains below the reporting threshold that triggers an investigation.
There is often a second-order cost as well: operator distraction. Every call-out interrupts a worker who may have been conducting quality checks, prepping for a changeover, or running another machine. The true cost of a feed failure goes beyond the idle robot. When modeling ways to increase welding productivity, human attention is the line item frequently overlooked.
The Uptime Lever: Emptying Real Bins Fully
In the lab, bin picking demos run on clean parts in pristine bins. On the shop floor, reality looks different: bins arrive dented from forklifts, with bent walls and warped bottoms. In practice, a large share of the bins circulating in a real plant – often on the order of 85% – are out of spec in some way relative to their nominal CAD geometry.
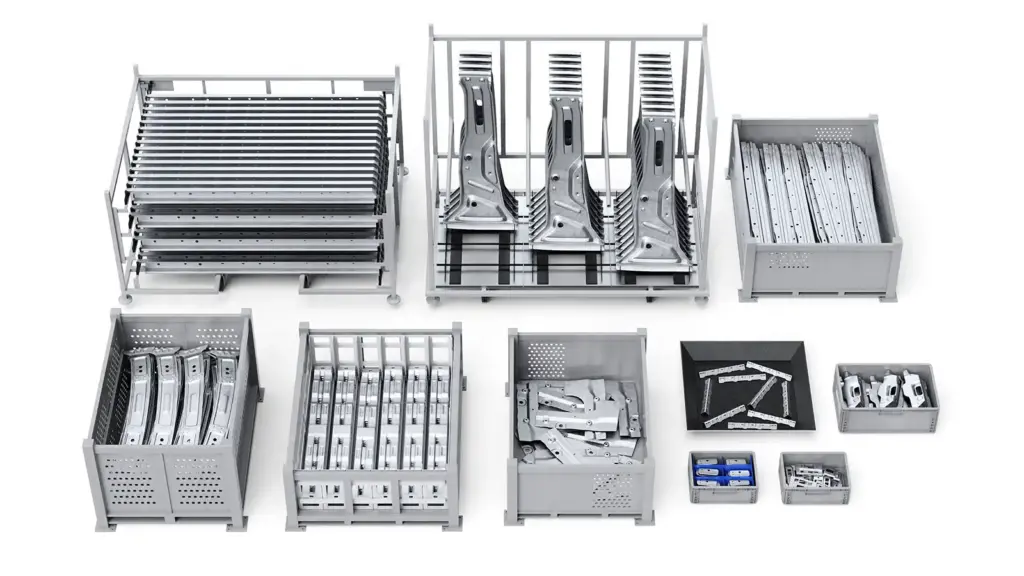
Why does this matter for ROI? Because a vision system that assumes an ideal bin does one of two things when reality deviates:
- It stops picking early, treating parts near a dented wall as unreachable – leaving 10–20% of parts stranded in every bin. Someone has to finish the bin by hand, or the stranded parts loop back through logistics. Either way, uptime and labor both take the hit.
- Or it collides, because the wall isn’t where the model said it was – and now you have real downtime and possible damage.
The uptime lever, then, is complete bin emptying under real conditions. That requires a vision system that scans the actual bin – walls, dents, and all – rather than trusting a nominal model, and a point cloud complete enough to see parts in corners, against walls, and partially occluded by their neighbors. This is where point cloud completeness stops being a datasheet metric and becomes a line-uptime metric: a hole in the data is a part left in the bin, and a part left in the bin is a person walking to the cell.
A cell that reliably empties damaged, real-world bins to the last part is a cell that runs unattended between bin swaps.
The Throughput Lever: Buffers and Decoupled Rhythms
A subtle killer of welding throughput is rhythm coupling: when the pick and the weld are chained in strict sequence, every variation in one delays the other. If the vision system occasionally needs an extra scan to resolve a difficult part, and the weld must wait for it, that variance lands directly on your cycle time.
Consider a cell with a 50-second weld cycle. The picking robot doesn’t need to beat 50 seconds on every single pick – it needs to average better than 50 seconds and keep a buffer full.
Now the occasional slow pick (a deeply buried part, a rescan) is absorbed by the buffer instead of stopping the arc. The weld robot sees an unbroken stream of parts; the vision system gets the breathing room to handle chaos gracefully.
So are you modeling welding automation? Are you trying to figure out how to increase welding throughput? Don’t ask just “how fast is the pick?” Ask “what happens to the arc when a pick runs slow?” If the answer is “nothing, the buffer absorbs it,” you’ve designed for throughput.
The Labor Lever: Nobody Standing at Bins
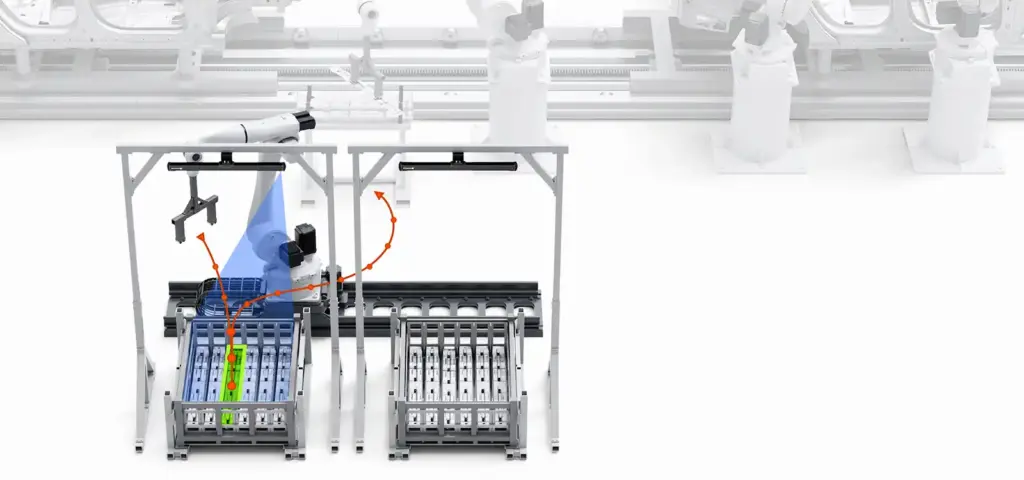
Walk most manually-fed welding lines and you’ll find the same role: a person standing at a bin, picking parts, orienting them, loading a fixture or tray. Eight hours of repetitive, low-value motion – often the least popular station in the shop, the first to show absenteeism, and increasingly the hardest to staff at all.
Automating the feed does something more valuable than removing a headcount from a spreadsheet: it relocates human attention to where it compounds. The operator who used to load brackets now runs quality checks, prepares changeovers, tends multiple cells, or handles the exceptions that genuinely need judgment.
In plants that struggle to hire the labor lever isn’t about cutting people; it’s about finally having enough people, because the robot absorbed the tasks nobody wanted.
There’s a reliability dividend here too, A feed that doesn’t depend on a person showing up doesn’t fail when that person doesn’t. Absenteeism stops being a production risk.
The Cost-Spreading Lever: One Vision Provider, Many Cells
Capital efficiency is where pick-to-weld automation quietly beats most alternatives. Structured feeding scales linearly and badly: every new part variant means new trays, new dunnage loops, new changeover procedures – recurring cost that grows with your mix.
A vision-guided picking platform scales the other way:
- New cell? The same vision platform, software environment, spare-parts stock, and engineering know-how carry over. Your team learns the system once and deploys it many times.
- Maintenance? Modern systems verify and correct their own calibration in-field, using the robot already in the cell – on a schedule and unattended. The calibration routine takes some robot time to run, so it’s planned for a production break rather than done mid-shift. Photoneo scanners’ own auto-maintenance is lighter still: it can run during regular scans, adding some time to the scan, or use marker dots with no impact on cycle time at all. Calibration drift gets caught before it costs you a shift, and you’re not paying for technician visits per cell.
The payback math changes accordingly. The first cell carries the learning curve; the second and third cells arrive at a fraction of the integration effort. Plants that standardize on one vision platform across their welding lines routinely see fleet-level payback that a cell-by-cell calculation would never predict.
A Simple Framework to Model Your Own Pick-to-Weld ROI
You don’t need a consultant to size this. Four numbers per cell, count an average shift across a period of time to get a picture:
1. Interruption cost. (Call-outs per shift) × (minutes per call-out) × (shifts per day) × (value of a welding minute). Count every walk-to-the-cell event, however small. This is usually the biggest and most underestimated number.
2. Stranded-part cost. (% of parts left in “empty” bins) × (bins per day) × (cost of manual finishing or re-looping those parts). If bins go back with parts in them, someone is paying for that somewhere.
3. Feed labor cost. (Hours per day of people loading, orienting, or pre-sorting parts) × (fully loaded labor rate) – plus a realistic estimate of what that time is worth redeployed.
4. Variance cost. (Cycles lost per shift to feed-induced waiting) × (contribution margin per part). This is your buffer/decoupling opportunity explained above.
Sum the four, annualize, and compare against the cost of a vision-guided feed, divide the platform’s learning-curve cost across every cell it will eventually serve, not just the first one. In most real body shops, the result surprises people: the robot was never the problem, and fixing the feed pays for itself out of downtime nobody was measuring.
Turn the Weld Feed Into Your ROI Lever
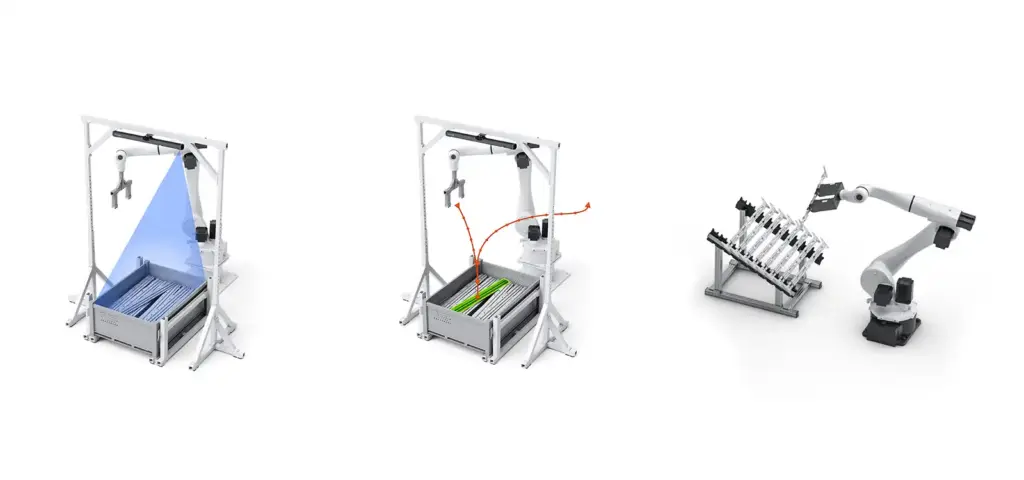
The welding robot is the most scrutinized asset on the line – and usually the least guilty one. Uptime, throughput, labor, and capital efficiency all trace back to the same upstream question: how do parts get from chaos to fixture? Answer it with a feed that empties real bins completely, decouples pick from weld, and scales across cells, and the ROI you were promised at purchase finally shows up in the numbers.


